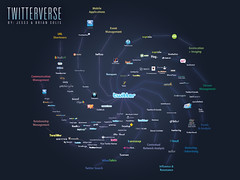
The Twitterverse was created in the spirit of http://www.theconversationprism.com/. This is a preview of the soon-to-be announced Twitterverse. (cc) www.briansolis.com + www.jess3.com.
this is interesting of the applications to share your thoughts accross the 'twitterverse'. I use twitter feed to share my actions on the net through blogging etc for people to follow. but there are many more.
looks good.
Saturday, 30 May 2009
Tuesday, 26 May 2009
Website as Graph
 Made by Marcel Salathe (email me: salathe.marcel AT gmail DOT com)
Type in your website url into the tool here: http://www.aharef.info/static/htmlgraph/
Very intersting way to see the structure of your html for websites, the key is below to the colours. The big red blue cluster to the bottom left is my blogroll with table, tr, td, a href TAGS in a big list hence the volume of the cluster. That was an easy part to spot.
What do the colors mean?
blue: for links (the A tag)
red: for tables (TABLE, TR and TD tags)
green: for the DIV tag
violet: for images (the IMG tag)
yellow: for forms (FORM, INPUT, TEXTAREA, SELECT and OPTION tags)
orange: for linebreaks and blockquotes (BR, P, and BLOCKQUOTE tags)
black: the HTML tag, the root node
gray: all other tags
found: http://www.dddinfographic.com/index.php/2006/06/08/websites-as-infographics/
might be old, so apologises for re-showing people
Desk Map

Eye Magazine advertising by cartlidge levene
this represents what was on the desks and where they were arranged for every employee, found in Mapping by tang fawcett p36. I posted this to the site a while ago and thought i'd share its quirkyness.
Visit my aStore for Mapping by Tang, Fawcett plus more books and amazon kindle
Thursday, 14 May 2009
Student Travel History

this was a data driven interface for the historical activities of the spanish
national scientific institution La Junta para Amplicaion de Estudios.
from 1909 - 1939 it tracks the studnets migration and its academic documents.
found here: http://www.bestiario.org/, this site had some excellant data visualisations.
Tuesday, 12 May 2009
What goes around comes around

great, awesome, anti war ads. sorry for short post, just had to expand the viewing of these, even if they might have already been around for a while. great design, visual thinking blog below where found.
from: http://kendalricher.com/blog/?p=241
via: http://theinspirationroom.com/
Brand Equity Visualisation

I thought this was an excellant diagram showing the interrelationships among
leading brand equity models of interbrand, aaker & simon and sullivan used to evaluate a brands ability to create value.
see here for defintions: Michael Porters Value Chain linked to Brand Equity Model Measures by vtm - at the bottom also.
quick summary, interbrand are used by the worlds leading brands to asses the
global monetary value of their brand to help them i their decision to buy sell
their brands. Diageo used interbrand to measure the value of PIllsbury brand
before selling, and others i havent researched.
long story short, my research in my studies relating to Design in Business led
me to Brand Equity and its measures and this wonderful diagram showed how
Interbrand, worlds leading brand valuer, didnt utilise this 'Brand Association'
attribute that other models do that arent as bigger global business.
This attribute measured 'success at creating a value image' that much
advertising is trying to do as they try to make you attach 'values', i.e.
wealth, cheapest, efficient, elegance etc to their Logo's/Brands.
I added, back in 2005, further boxes branching off from 'Brand Association' that
ought to be measured by Interbrand such as, the competency of the advertising
agency who are trying to create this value image. AMV BBDO are damn good and
experienced and multi award winning at achieving values for brands.
Directors, the same, Frank Budgen has won many ad awards at creating value
through a brand image.
well my studies
4 years later they will have probably already integrated this into their
measures of brand value when rankking coca cola, macdonalds & microsoft
(they were top when i was researching).
All rights reserved © 2009 to myself and the other respective owners © 2009
the article i found the original diagram from was available on Emerald full
text. Athens authentication required.
http://www.interbrand.com

Michael Porters Value Chain linked to Brand Equity Model Measures by vtm
also check out for further attribute measure (boxes) definitions: http://visualthinkmap.ning.com/photo/michael-porters-value-chain
Saturday, 9 May 2009
Creating a Sun
Some very interesting processing work by Robert Hodgin. Here he describes his sphere attempts.
'I have always been and will continue to be impressed with the simple sphere. Such a basic shape, so easy to visualize but so complex to code. Early in my Processing experience, I decided I wanted to learn what translate, push and pop were capable of. I had no previous experience with these methods borrowed from OpenGL but I soon realized it was a necessary stepping stone to better understanding how to experiment with objects in 3D space. I stumbled upon a pseudo-code explanation which used the idea of a solar system to help explain these methods. Start from the sun, push a new matrix onto the stack and translate out to place Mercury. Pop back to the sun and push and translate out to Venus, etc.
A few years later, I have come to understand some of the intricacies of working with spheres and my love for additive blending is in full bloom. '
from: http://www.flight404.com/blog/?p=155
found: http://hawk.jensfranke.com/ss09/processing/linksammlung/
Thursday, 7 May 2009
Journal of IA

A remix of Georgian Dance by flyergeorge, released under the provisions of the CC BY SA 2.0 license.
The Journal of Information Architecture is an international peer-reviewed scholarly journal. Its aim is to facilitate the systematic development of the scientific body of knowledge in the field of information architecture. http://journalofia.org/
The Journal of Information Architecture is published biannually in English and Volume 1, Issue 1 is the current issue. Read more about the Journal » The Call for Papers for Volume 1, Issue 2, to be published Autumn 2009, is now open. Read the Call for Papers »
Here are the papers in Vol1.
Dorte Madsen's Editorial
Shall We Dance?
“ But where is the research in information architecture? (...) You may come across
research involving information architecture or relevant for information
architecture, but not necessarily written with a specific purpose of developing
the field of information architecture, of adding to the body of knowledge about
information architecture, developing concepts for information architecture, nor
in general addressing the theoretical foundations of information architecture.
Now, with a Journal of Information Architecture, we have a forum where we can
publish what is central to the development of the field of information
architecture. ”
Download Shall We Dance? in PDF format »
Gianluca Brugnoli
Connecting the Dots of User
Experience
The article presents a point of view about analyzing and designing the user experience within
pervasive networks made of distributed services and applications, where the user is the primary actor who freely and opportunistically connects and activates the system components following an activity-driven process. A digital content case study is used to outline the main characteristics of this scenario and to introduce a tool for user experience modelling and designing. From the
application of this model are proposed some considerations about how the design process could change to support this vision.
Download Connecting the Dots of User Experience in PDF format »
Helena Francke
Towards an Architectural Document
Analysis
Information architecture (IA) and document architecture (DA) provide two, partly overlapping, perspectives on the creation of document structures. This article suggests how the architecture of a document can be analysed from these two perspectives. Literature on IA and DA has been examined in order to identify central ideas that are of relevance for analysing the architectures of digital documents. The article contains an overview of how IA and DA have been used and
defined. The article shows how a model for analysing documents as sociotechnical artefacts can fruitfully draw on parts of the theoretical and practical complexes of IA and DA. The aspects that are identified as particularly important from IA are organisation systems, navigation, and labelling. From DA, logical structures, layout structures, content structures, and file structures
are all applicable aspects. It is discussed how these various aspects may be interpreted in order to support an analysis of the organising principles of documents.
Download Towards an Architectural Document Analysis in PDF format »
Andrew Hinton
The Machineries of Context
The essay re-frames Information Architecture as designing context in the digital layer, contending that IA has always been less about organizing information than about designing architecture for a new kind of contextual space. It explores how a global network of user-created hyperlinks has changed how we experience context, and how IA practice emerged to contend with this change. In addition, the essay proposes that IA study and practice develop tools and methods that improve our understanding and methods for solving the increasingly complex design challenges brought about by this new contextual reality.
Download The Machineries of Context in PDF format »
James Kalbach
On Uncertainty in Information
Architecture
Uncertainty, in general, is a fundamental aspect of human activity and underlies much of our
decision making. The notion of uncertainty in information seeking, in particular, dates back to Shannon and Weaver (1949) and since then has been investigated in many forms. Kulthau's (1993) work on information uncertainty is perhaps the most extensive. Through two specific examples, this article proposes uncertainty as a unifying heuristic in information architecture. Measurements of uncertainty can serve a diagnostic function in both the design and evaluation of information technologies and user interfaces.
Download On Uncertainty in Information Architecture in PDF format »
See also:

Saturday, 2 May 2009
Emotion Map
Worcester Waterfront is an exciting 2 year project to improve the city’s riverside. It will provide more seating and paving,
suitable lighting, interpretation of the natural and social history of everything along the route and linking up all sorts of places and stories along the way. The idea is to also achieve the building of another bridge across the river for pedestrians and cyclists at Diglis Island, to form one of the best two and a half km circular walks in the country.
suitable lighting, interpretation of the natural and social history of everything along the route and linking up all sorts of places and stories along the way. The idea is to also achieve the building of another bridge across the river for pedestrians and cyclists at Diglis Island, to form one of the best two and a half km circular walks in the country.
Through Andy Stevenson at Worchester university the council are using a new form of multimedia visualisation to help develop the Waterfront proposals, both to illustrate the route online, and to gain opinions about the area to inform the design. The method, which involves satellite (GPS) tracking, heart rate monitoring and listening to audio commentaries is helping to show how individuals both utilise and react when out travelling along the riverside paths near Worcester’s City Centre.
The system is being developed to help the progress of the design and to see how stretches of the riverside can be most
effectively enhanced for all users.
Emotimap is great idea and Andy and the team are currently planning how to make this visualisation available commercially. It has some good attempts at linking colour and emotion to geographic location. here is the link to the project for the worchester council http://www.worcester.gov.uk:8080/emotimaps/
An image taken from the map showing the coloured ‘mood’ markers.
Andy has also done an interesting project featured at Movement Mapping on Flickr that is creative capturing a peculiar
variable of the cat.
Good stuff. thanks for the embed link andy.
Subscribe to:
Posts (Atom)