really love these from volview software that are uploaded by kit ware on flickr.
Thursday, 26 February 2009

Friday, 20 February 2009
Grid Designer Tool
Brilliant. i love web tool's that save a large amount of time coding and remembering attributes and the syntax <> halb < /h2 > etc... Well josef muller brockmann of the digital age eat your heart out.
1st use your mouse and click increase decrease etc to create the layout you desire

2nd decide upon your font...
with helvetica available... although i am not sure how wide spread helvetica comes with systems, does on macs... can get a pc version from http://graphicallyinspired.blogspot.com there is a link there to helevetica free for download.
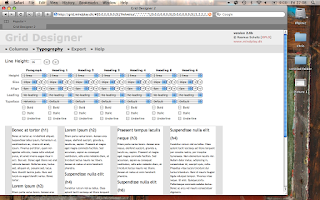
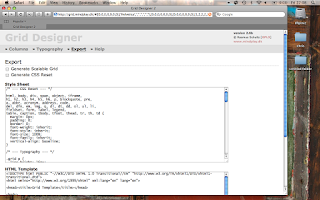
3rd copy paste the generated css style sheet, or just the basic html to squeeze in between your BODY tags somewhere.
http://grid.mindplay.dk
thankyou Rasmus Schultz
found in march 08 creative review
VizThink 09 - 2 days

Viz Think 09 - San Jose - 200 dollars discount code DCCX01
Time: February 22, 2009 to February 25, 2009
Location: San Jose, CA
Street: 170 South Market Street 95113
Website or Map: http://www.vizthink.com/
Event Type: conference, workshop
Organized By: ryan coleman & tom crawford
Latest Activity: 26 Jan
Event Description
It’s not long until VizThink 2009 in San Jose, CA and the final details are coming together. They’ve got a beautiful venue, a fantastic roster of facilitators & two and half days of the best visual thinking content available. Their interactive-oriented sessions ensure that you’ll walk away from VizThink with new skills, ideas and inspiration to put to work in your own world. Just register and enter DCCX01 when prompted to get 200 dollar discount applied automatically!
"Attending VizThink provided the tools and inspiration I needed to harness my natural visual thinking. I've already used my new-found skills to more effectively communicate and facilitate product design sessions.
- Josh Jacobson, Yahoo! Inc.


Here’s just a taste of the companies represented by their attendees: Academic &Not-for-Profit The George Washington University, Strategies for the Future, Corporate Adaptive Path, Apple Inc, Procter & Gamble plus many more...
Register Today & Save!
To help people stretch that dollar a little further here is the discount code DCCX01 that will let you cut 200 dollars off the regular registration rate for the VizThink conference. Just register and enter when prompted - your discount will be applied automatically!
Many airlines are having seat sales right now and, while they recommend staying at the conference hotel a quick search of the discount travel sites will find many accommodation deals in the area (w/many hotels under $100/night).
Let Your Friends, Coworkers and Clients Know! (and pass along the discount code too!)
Sunday, 15 February 2009
Functioning Ferdinand
Saw the first image in a recent post and pleased , like with 389 Type that information arent these word clouds, and it reminded me off ferdinand kriwet's work the second image with concrete poetry. always appreciate it concrete poetry Mississippi Type Visual . Is it functioning form? (the first from flowing data)


Internet Histo-graphic
"History of the internet" is an animated documentary explaining the inventions from time-sharing to file-sharing, from arpanet to internet. The clip shows a brief overview of this history and shall animate to go on discovering the history of the internet.
The history is told with help of the PICOL icons, which are also a part of the creators diploma.
The icons are available for free on picol.org in the size 32x32 pixel
See the whole diploma >>
from here: http://www.lonja.de/motion/mo_history_internet.html
found here: http://feeds.infosthetics.com/~r/infosthetics/~3/_UrqWTLSAPo/the_history_of_the_internet.html
Credit
Director & Animator – Melih Bilgil
Voice over – Steve Taylor
Music – Telekaster
Translation – Karla Vesenmayer
Scientific Managment – Prof. Philipp Pape
University – University of Applied Sciences Mainz
Thanks to – Barbara Bittmann, Johannes Schatz
Sunday, 8 February 2009
Descry - verb. to discover by looking carefully

Excellant project for data visualisation that i was sent is mix online from micrsoft.
There are a few visualisations there, an intersting one on american presidents first speeches in a treemap.
But the one i have shown here is the obesity epicemic visualisation. i really loved the alternate arrangemtn function of by obesity rate, as it gives a much greater overview for me of the overall obesity epidemic throught the lovely graduated scale of light to dark of red for the density of obesity in each particular state.
size nice idea, but the small would be small and probably reduce legibilitity. the colour graduation works.
i agree with nishant that some poeple want more, answers elaboarted, but an inofgraphics purpose, minimal level of success, is to arouse curiosity about the subject matter at hand.
i assume this extra axis is a way of adding isometric/3d like i saw recently at infoaesthtics where there was a 3d treemap. this might work.
as someone said, the geographic depiction for states is tempting and far easier but would elicit focus on the extremes of the data such 'the south are...'.
i would say as a person with a pathetic knowledge of states in america, the abbreviations to MO for MISSOURI is a good sapce saver, but the key needs to easier to detect as i only just noticed the faint white contrasted to grey for the identification difficult to detect. i like the soft grey, white and pastels but maybe a stronger white/black might be easier.
maybe the small geographic map used as a key for states, not to show the density of obesity for each state, but a basic mouse over (since its interactive) that highlights the state in the key with a single like grey just to make it easier to recognise the state, rather than just the letter links. But this might take it to the 'south are...' still, which you wanted to negate.
overall i liked it and it definetly works to initiate curiousity and is soft on the eye with alternate ways of presenting the data (ascend/descend) & (alpahbet/rate), which i think is extremely useful where possible.
love the project though. will have to rememb to keep checking on your latest and liked the aricle about focus on the question and could tak efrom it even though it 'skim read btw' seemed coding orientated.
very good, thanks nishant.
also seen an obesity visualisation at vc http://www.visualcomplexity.com/vc/project_details.cfm?id=622&index=622&domain=
Thursday, 5 February 2009
Text 2 Mind Map

This is an excellant, easy to use online mind mapping tool.

Visualise your ideas, thoughts in the text editor on the left, to create a new node/level simply use TAB key and to go back a level, new main node BACKSPACE key, like you do in WORD. Honestly, you need to nothing of design, mind mapping, visualising and it creates the top map that you can view full screen with the controls on the right.
As for the quality of the visualisation, the more TAB levels you create the colours automatically create give you an excellant single tone harmony (faber birren) and it changes in its size both working together to create a very effective hierachy of information. You can change the colours.
The functionality is excellant, simple, clear and to make it transferrable from their site you can easily click Save Map and it generates a flattened jpeg that opens in a new window, so allow popups.
To make changes just tweak your text editor on left and click convert to mind map.
I shouldn't go over the top, but to find such a easy, effective, simple to use online tool is great for those who prefer the speed of digital manipulation, than that of on paper and then having to scan/photog to share digitally, very good.
I just shared some ideas of my research from particular books to test its visualisation effects.
Thanks Arnaud, again...
found here: http://as-map.com/blog/index.php/2009/01/12/1077/
Tuesday, 3 February 2009
Memory Visual

I wanted to understand the difference between Kbps and Kb, memory and internet speeds.
Internet - data transfer speeds is - kbps = kilo bits per sec
Memory - file sizes/capacity is - KBps = Kilo Bytes per sec
8 bits = 1 byte
So on a 56 k... bits per sec modem (dial up) you can download 7 Kilo Bytes Per Sec. of a particular file.
Therefore if you follow the bottom with the icons you can see the file sizes/capacities of different hardware/software... could in future differentiate/seperate the 2 but most people are aware of what is hardware and which is software. Allows for contextualising the file sizes/capacities together, tufte would say seperate.
Suppose people have to remember that it increments in hundreds for KB, then increments in hundreds for MB, GB.... So there isnt the same amount measured. there is a new ratio.
tried to make this explicit with the MB ratio to B, i.e. 1 MB = 1,000,000 Bytes
I provide a table to give estimates of total secs for particular file sizes, linking the differentiated ratios to the KB, MB ratio's.
Well, creating this helped me realise the actual download file size/capacity of my broadband which isnt 2MBps (basic sky), it is 244KBps, slightly smaller.
I love how the isometric gives the non-physical data an abstract space, and make you associate file sizes, speeds with volume, area, capacity like its filling land creating measure of distance associated with time. Its no longer just stats & figures.
Memory sticks, ipods are now topographic landmarks that can be contrasted in their volume/file size capacity to each other.
There may be a better rendering, representation of the data, maybe an isometric '3d' treemap, or an isometric pyramid, but I think it is a pretty good attempt to simplify complex data with quite a few variables,
internet data speed - dial up 56kbps, broadband, wireless broadband
internet download times - i.e. not just per seconds... i give average totals
file sizes/capacity - B, KB, MB, GB
contemporary products/prices - their capacity in relation
well much help was from here with calculating data speeds/file size per sec
http://www.tamiltorrents.net/forums/showthread.php?t=30078
almost like for like table of estimate file/broadband times
http://www.broadband.co.uk/guide.jsp?section=3
wireless networks, speeds such as GPRS, HSCSD, EDGE (usa), GSM
http://www.mobile-phones-uk.org.uk/gprs.htm
plus other places, but these were the main.
Please feel free to comment, please do ask permission before reproducing i.e. printing, if on the internet please reference this post or http://chriswatsondesign.viviti.com/ .
See more of my work at http://chriswatsondesign.viviti.com/
Hope you like.
many thanks to arnaud velten - as map, claude achenbrenner - serial mapper
Subscribe to:
Posts (Atom)